Measuring an Ultra-Low-Noise 100 MHz OCXO with Cross-Correlation
Ultra-low-noise reference oscillators can push a phase noise analyzer to its own residual floor. This note walks through how the BNC 7000 Series, with options CC and HP, uses two-channel cross-correlation to measure a 100 MHz OCXO below that floor.
Introduction
This application note describes the phase noise measurement of very low noise reference sources. This note applies to using the BNC 7000 Series with options CC and HP included.
This note describes how to best use the 7000 Series to measure ultra-low single sideband (SSB) phase noise of devices under test (DUT). In the following example, 100 MHz OCXOs from NEL frequency control are measured using the two-channel cross-correlation technique.
Overview of the Two-Channel Cross-Correlation Technique
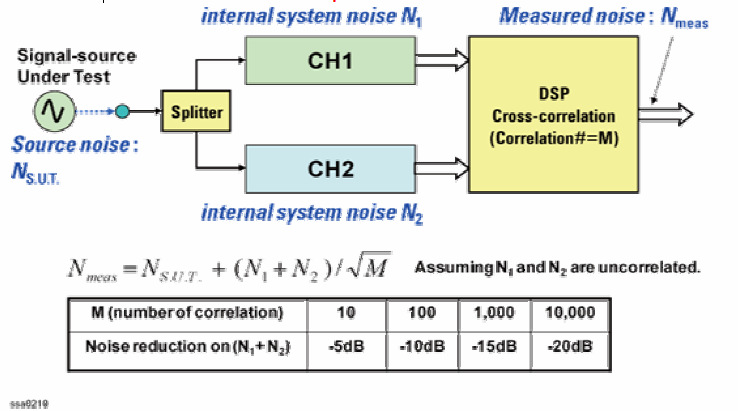
The cross correlation technique uses two signal-channel measurement systems. Only the coherent noise present in both channels will average to a finite value. The time average of the incoherent noise will approach zero as M-1/2, where M is the number of average. The measured phase noise of the system is represented as the equation shown above in Figure 1:
Nmeas = NS.U.T. + (N1 + N2) / √M (assuming N1 and N2 are uncorrelated).
| M (number of correlation) | 10 | 100 | 1,000 | 10,000 |
|---|---|---|---|---|
| Noise reduction on (N1+N2) | -5dB | -10dB | -15dB | -20dB |
Measurement Setup
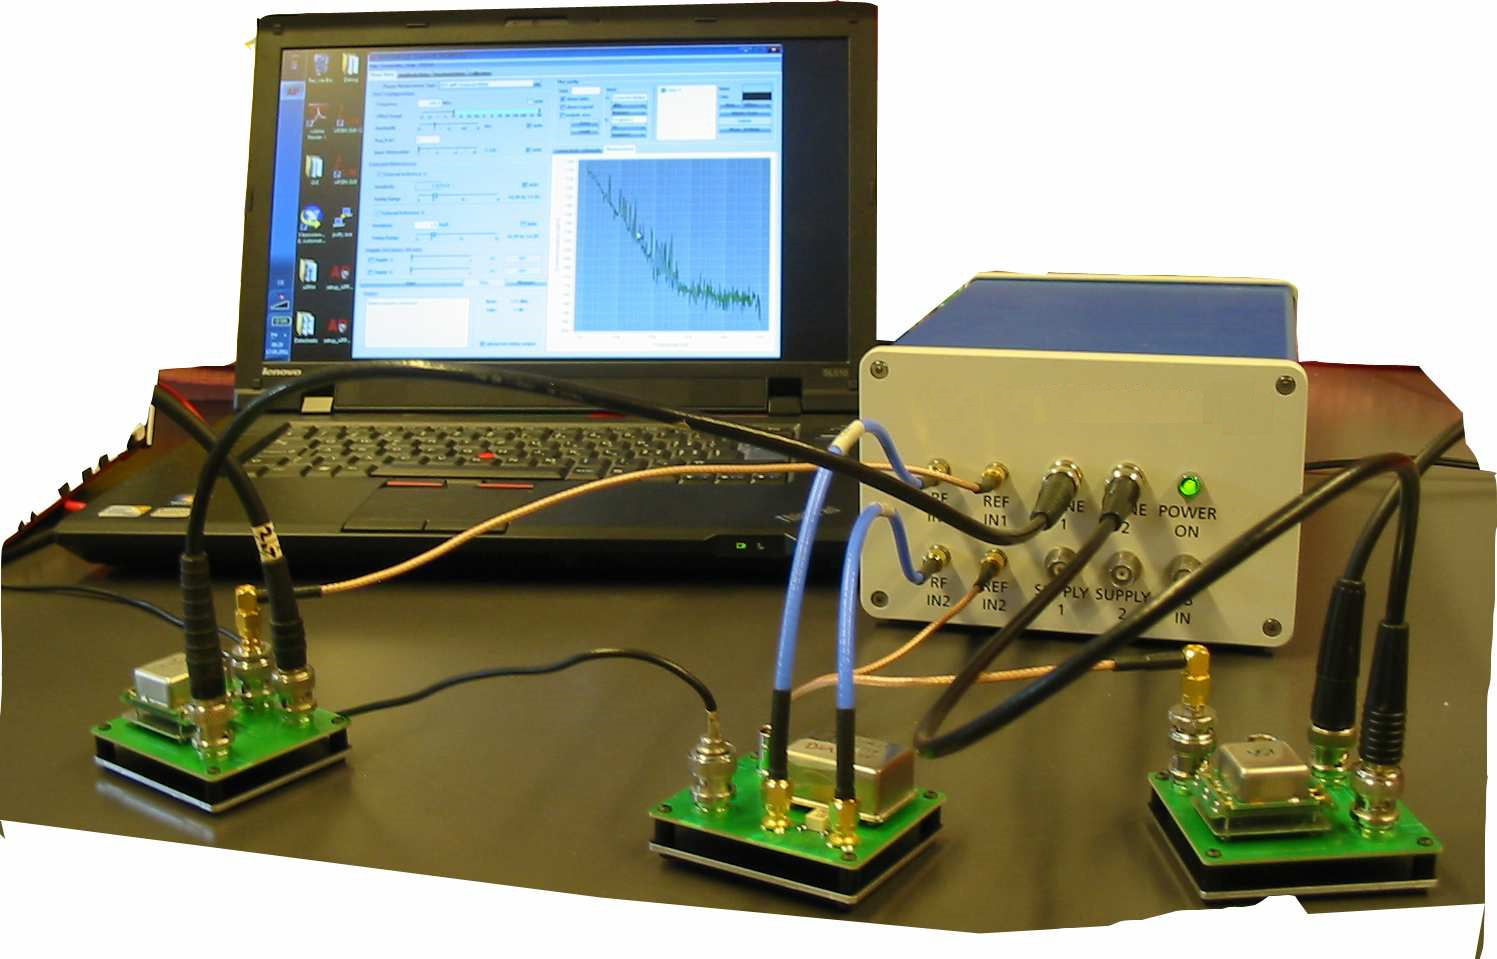
For this example, three 100 MHZ OCXO from NEL Frequency Control are used as DUTs and tunable references. The measurement setup is shown below in Figure 2.
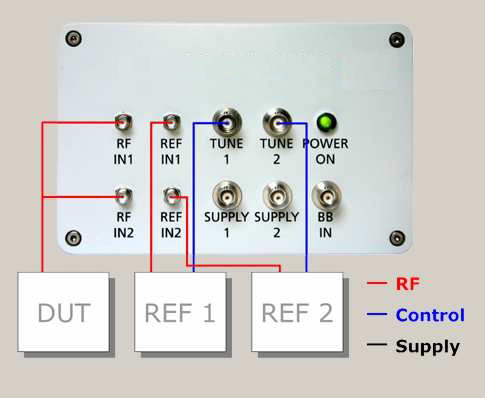
The connectivity schematic is shown below in Figure 3. The outputs (RF, and tuning port) of the two references are connected to the REF and TUNE ports of the Model 7300 Series PNT. The DUT signal is split using a power splitter on the test fixture and fed into the two RF inputs of the BNC PNT.
Before starting the measurement, the following configuration is required. For details, please refer to the user manual.
- Select the measurement configuration: DUT with Cross-correlator
- Set the number of correlations per decade. In this example, the correlations are set to 100 for 10 Hz to 1 kHz offset, 1,000 for 1 kHz to 10 kHz offset, and 10,000 for 10 kHz to 1 MHz offset.
- Set the tuning range of external references. In this example, the tuning range for the reference OCXOs are set at 0 to +8.0V.
Note. This range depends on the tuning range of your reference and must be set accordingly to avoid damaging your reference.
- If the sensitivity of the external sources is not known, the auto button can be selected to apply auto-detection of the tuning sensitivity.
To start the measurement, press the Start button.
Measurement Results
Figure 4 below shows the measurement results.
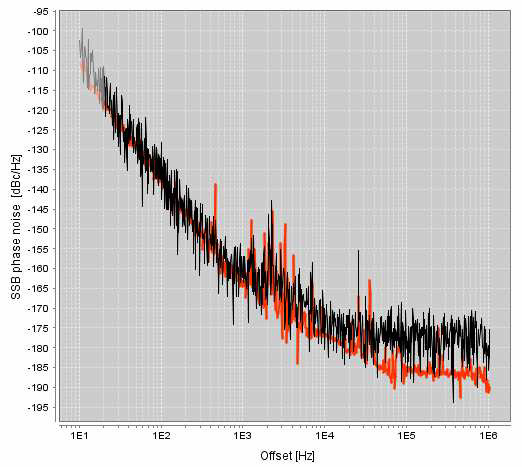
In Figure 4 above, the black curve shows the measurement after only one correlation and approximately two seconds of measurement time. For frequency offsets above 1 kHz offset, the phase noise floor is limited by the PNT residual noise at approximately -177 dBc/Hz. To overcome these limitations, further correlations are performed.
The red curve shows the result after 100 correlations and approximately 100 sec of measurement time (to be precise, 100 correlations are measured for 10 Hz to 1 kHz offset, 1,000 for 1 kHz to 10 kHz offset, and 10,000 for 10 kHz to 1 MHz offset, respectively). As expected, the phase noise at lower offsets (<1 kHz) has not improved substantially further and the curve shows little variance, indicating there will be no further noise improvement with additional correlations.
For offsets >1 kHz, the phase noise improvement is considerable (up to 10 dB). A noise floor of -187 dBc/Hz was measured for this 100 MHz OCXO.
Conclusion
In conclusion, the BNC 7000 Series with option HP and option CC offers users a high-performance two-channel cross-correlator phase noise measurement system, capable of measuring ultra-low noise OCXOs with noise floors as low as -190 dBc/Hz.
Talk to an application engineer
If you are characterizing a low-noise OCXO or another quiet reference and want to confirm the 7000 Series with options CC and HP fits your measurement, our engineers can help scope the configuration. Request a quote or a demo and we will follow up with the right setup. You can also reach us at info@berkeleynucleonics.com or 800-234-7858.
Ask now → Chat with our assistant and get an answer in seconds.