RF Geolocation & Mapping
A spectrum analyzer tells you what a signal looks like. It does not, on its own, tell you where the signal lives. RF geolocation closes that gap. It binds every measurement to a position so the answer to "is there interference here" becomes "the interference sits at this corner, on this channel, at this power." That shift from spectrum to map is what makes a field investigation tractable.
The hard part is that radio waves do not travel in clean straight lines through the real world. Buildings reflect them. Terrain blocks them. A strong multipath echo can read louder than the source you are hunting. A single power reading at a single spot means little. You need many readings, taken across a route or a grid, each one stamped with an accurate position and time, before a pattern emerges. Doing that by hand with a notebook and a clipboard is slow, error-prone, and nearly impossible to repeat. The measurement chain has to be automated, portable, and trustworthy enough that the map it produces survives scrutiny.
How the ICX-FieldHawk line solves it
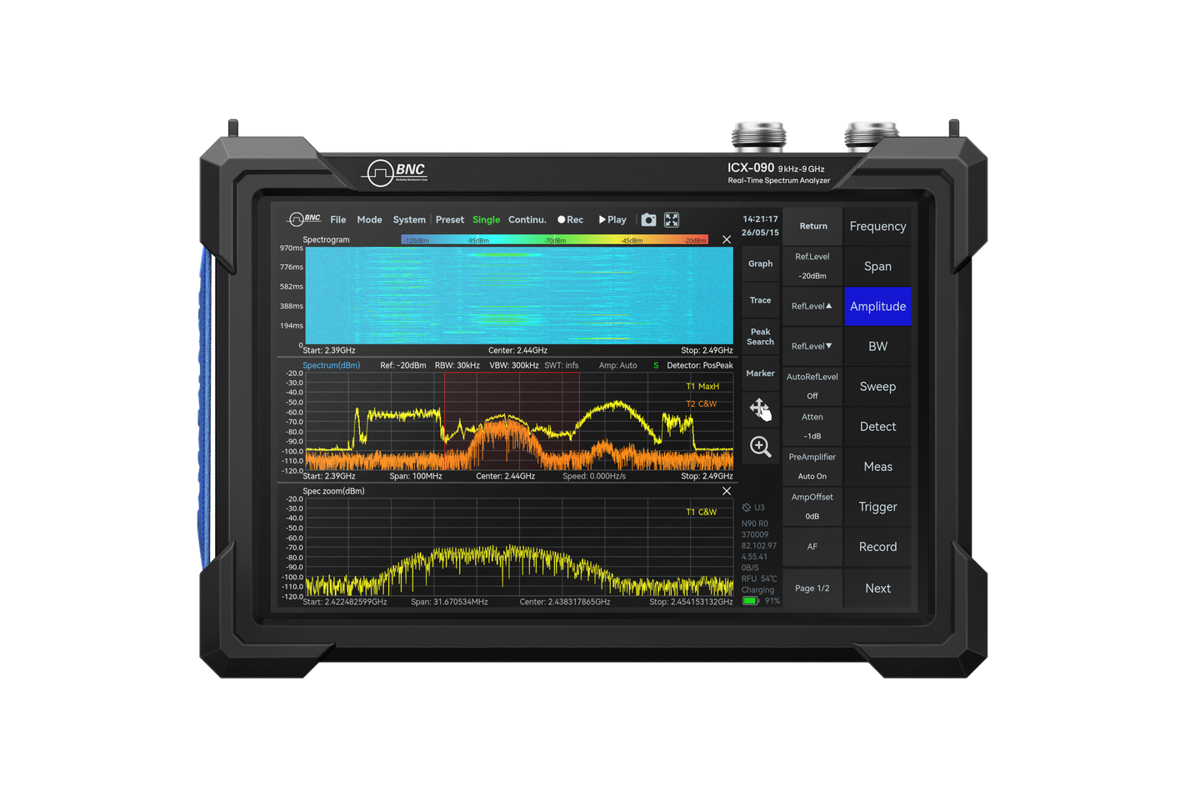
The ICX-FieldHawk platform supports this work in two forms. On the ICX-045, 060 and 090 handhelds, Mapping mode is standard: GPS-referenced heat maps for radio monitoring and interference analysis, with each capture tied to position and time. On the USB/LAN modules and the 9.5, 20 and 40 GHz handhelds, the analyzer streams calibrated measurements with GNSS-synchronized timing (1PPS to ±100 ns, ±75 or ±50 ns with options) to the host, and the survey software does the mapping. Two complementary methods apply.
The first method is the signal-strength heat map. As the operator walks or drives a route, Mapping mode on the ICX-045, 060 and 090 records channel power at every point along the way and paints it onto the map as a color gradient. Hot zones and coverage holes read directly, and the brightest cluster is the first estimate of the source location. This approach suits a broad picture taken quickly: where a transmitter reaches, where it does not, where a noise floor climbs.
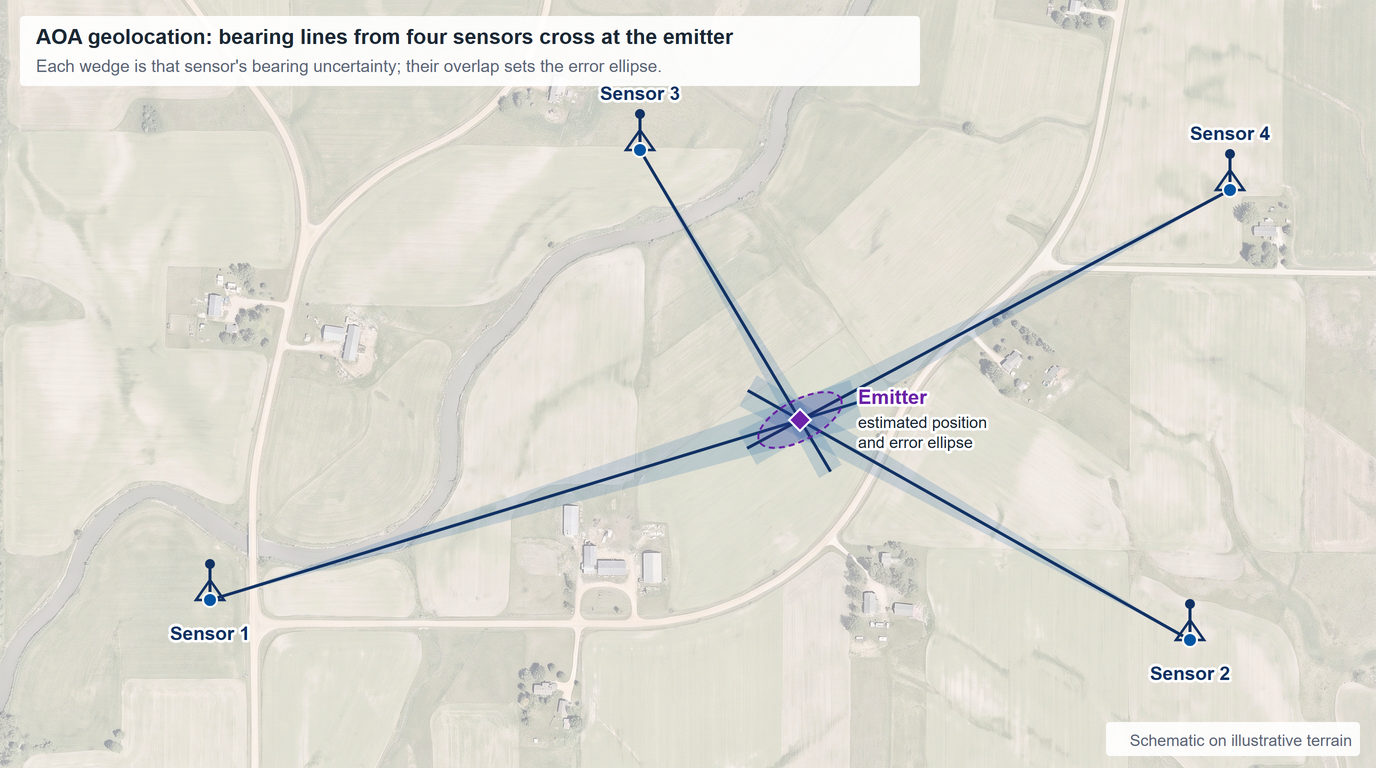
The second method is direction finding by triangulation. Using the RFA-3100-N directional antenna, the operator takes a bearing toward the strongest signal from one location, then moves and repeats from two or more separated positions. The RFA-3100-N reports azimuth, pitch and roll from its built-in attitude and heading sensor and the analyzer applies its antenna factors automatically. Plotted on the map, two bearings give a fix; three or more give a fix with an error estimate from the spread of the crossings, which is what the figure at the top of this brief shows. Bearings are less misled by a single strong reflection than a heat map is, though multipath corrupts a bearing too, so take them from positions with a clear view. It is the method of choice when the source is weak or intermittent.
Both methods run on the same hardware and the same software. Channel power, occupied bandwidth and the GNSS timestamp are available through the API for every capture, and Data Record and Playback keeps the raw IQ of a route for later analysis. The USB module draws 10 to 14 W from a 5 V, 2 A Type-C supply, so it runs from a laptop or from a single-board Linux host with its own power module, and at under 420 g it flies as a UAV payload (see the drone spectrum monitoring brief), lifting the measurement above clutter to cover ground no vehicle can reach.
Which models and accessories fit
The right configuration depends on how the team moves and where it works.
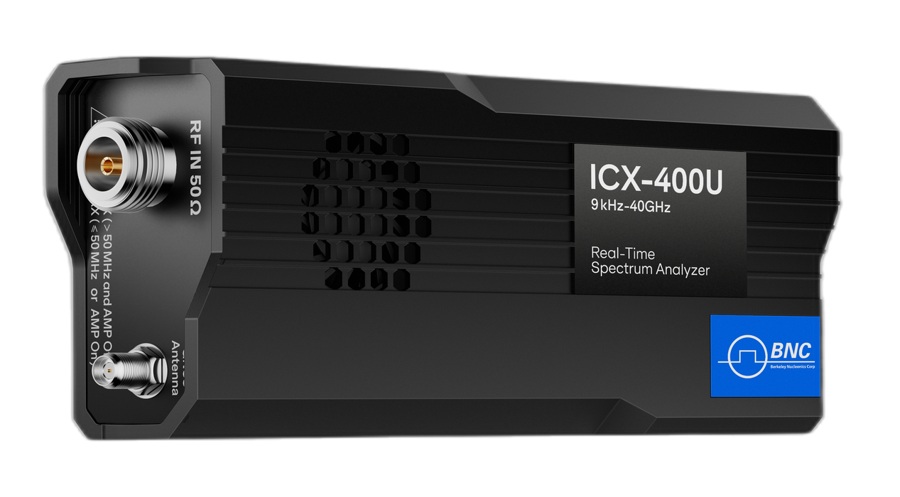
For drone payloads, embedded rigs and single-board hosts, the ICX-Series USB analyzer (ICX-200U to 20 GHz, ICX-400U to 40 GHz) is the natural choice: under 420 g, 10 to 14 W, and one API for whatever computer it is bolted to. This is the model for an analyzer that rides in a vehicle, hangs under a drone, or sits inside a fixed monitoring node.
For operators on foot who need a self-contained instrument with its own screen, the ICX-FieldHawk keeps the survey in one hand. No host computer, no cables to manage, no fragile setup in the rain. For field conditions that punish equipment, the ICX-FieldHawk-R variant adds an IP68 impact-protected chassis without changing the measurement workflow.
The RFA-3100-N directional antenna is the key accessory for any direction-finding job. It covers 500 MHz to 10 GHz with 5 dBi typical gain, a front-to-back ratio above 15 dB and a 20 dB amplifier that can be bypassed, so it pulls in weak distant signals with the amplifier on and handles strong nearby ones with it off; its attitude and heading sensor reports the bearing. The directionality is what makes bearings possible. Without it, triangulation has nothing to point with.
Use the heat map when you want coverage at a glance across a wide area. Switch to RFA-3100-N triangulation when the area is dense or the source is weak or intermittent, and take each bearing from a position with a clear view.
Use cases in the field
Cellular and 5G teams use mapping to validate coverage and find dead spots before customers do, turning a subjective "service feels weak here" into a measured gradient on a street map. Regulatory bodies and enforcement officers use direction finding to hunt unlicensed transmitters and run down interference complaints, and keep a position-stamped record for the case file. Defense and TSCM teams use the same toolkit to sweep facilities for unauthorized emitters, working indoors against custom floor plans where a hidden device has nowhere to blend in.
Recommended configuration
For a flexible, do-everything geolocation kit, pair an ICX-Series USB analyzer with a GNSS receiver, the RFA-3100-N directional antenna, and SpectraCore running on a lightweight host. That bundle handles triangulation and route logging, mounts to a vehicle or a drone, and scales down to a single-board host for unattended work. Teams that survey on foot and want the built-in heat map should add an ICX-045, 060 or 090 handheld, which carries Mapping mode as standard, and operators in harsh environments should specify the ICX-FieldHawk-R chassis.
To scope a kit against your terrain, host platform, and frequency targets, contact Berkeley Nucleonics at info@berkeleynucleonics.com or 800-234-7858.
For a quick question, chat with an engineer at berkeleynucleonics.com.