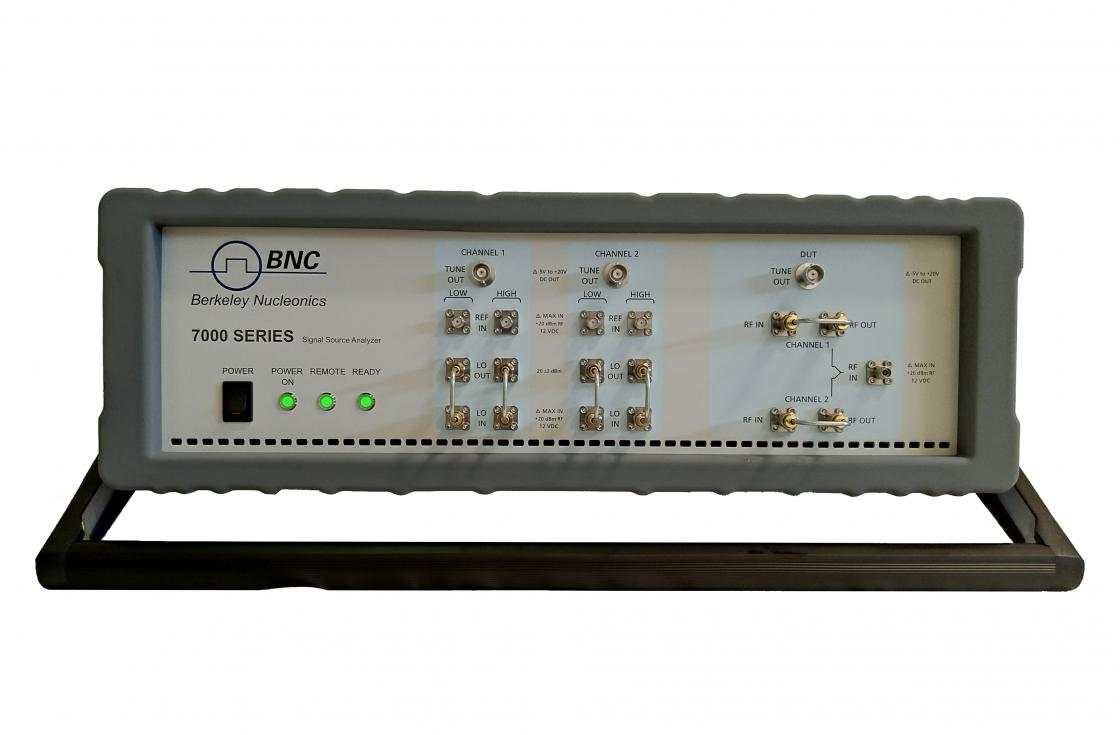
A frequency synthesizer's phase noise is the number its designer most wants to improve and the one hardest to measure, because the instrument making the measurement has phase noise of its own. Valon Technology, LLC builds precision frequency synthesizers and keeps a 7300 Series Signal Source Analyzer on its engineering bench for exactly this problem. This customer story works through one of its measurements: the 6 GHz output of a Valon 5009 synthesizer on the two-channel cross-correlation analyzer, made to compare three settings of the synthesizer's phase-locked loop. Stuart Rumley of Valon Technology shared the measurement and the bench practice behind it. The sections below show how the instrument's contribution is separated from the source's, why the drive level into the analyzer matters, how a supply regulator's noise is measured before it reaches the carrier, and what the trace integrates to. Valon's engineers use the analyzer to see effects as fine as a voltage regulator's contribution to phase noise and the drive level that gets the best performance from the analyzer; sections 4 and 5 put numbers on both. The numbers are those of Valon's measurement, and the method applies to any synthesizer, VCO or clock at any carrier the analyzer covers.
1. The question a single spectrum does not answer
A spectrum analyzer tuned to a 6 GHz carrier shows the carrier on a pedestal of noise. The display is the sum of two things: the synthesizer's own phase noise, and the analyzer's local oscillator noise and displayed noise floor, which it adds to everything it measures. For a source that is much noisier than the analyzer the sum is a fair reading of the source. For a good synthesizer it is not, and the trace alone gives no way to tell which case applies. The reading is high by 10 log10(1 + 10−m/10), where m is the number of decibels by which the source exceeds the instrument's floor: 0.41 dB high at a 10 dB margin, 1.76 dB at 3 dB, and 3 dB when the two are equal. A designer trying to decide whether a change to the loop filter gained 2 dB at 1 kHz offset cannot resolve that from a measurement whose floor is within 3 dB of the answer.
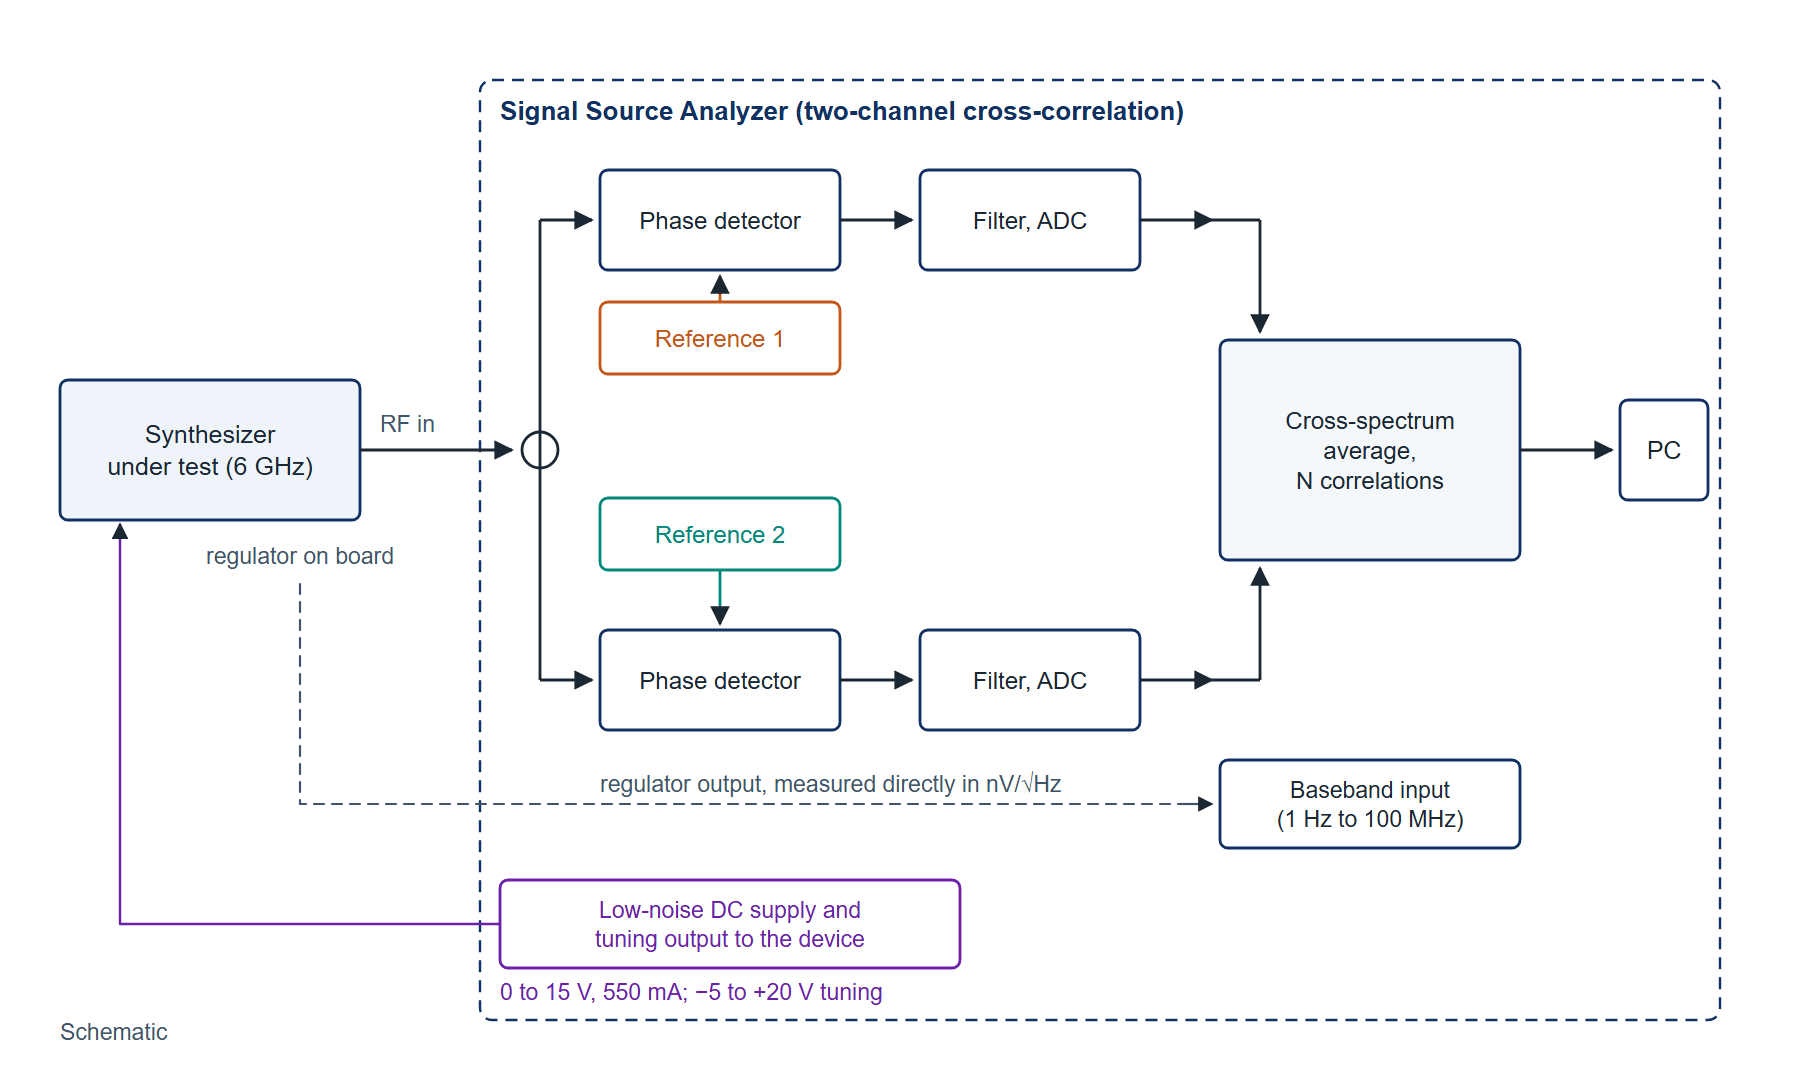
Two-channel cross-correlation is the architecture that answers the question. Figure 1 draws it. The device under test is split into two phase-detector channels, each with its own independent reference oscillator. The device's phase noise is identical in both channels; each reference's noise and each channel's electronics noise is present in one channel only. Averaging the cross-spectrum of the two channels over N measurements keeps what is common and reduces what is not by 5 log10 N dB: about 5 dB after 10 correlations, 10 dB after 100 and 15 dB after 1000, the figures the 7000 Series datasheet publishes. The device's noise is not averaged away, because it is in both channels. The instrument's is.
2. The measurement
The synthesizer was set to 6 GHz and connected to the analyzer's RF input. The analyzer's internal references were used, the offset range was 10 Hz to 1 MHz, and three traces were recorded, one for each of three charge-pump current settings of the synthesizer's loop. Markers were placed at each decade. Figure 2 shows the trace for one setting and the marker values read from it.
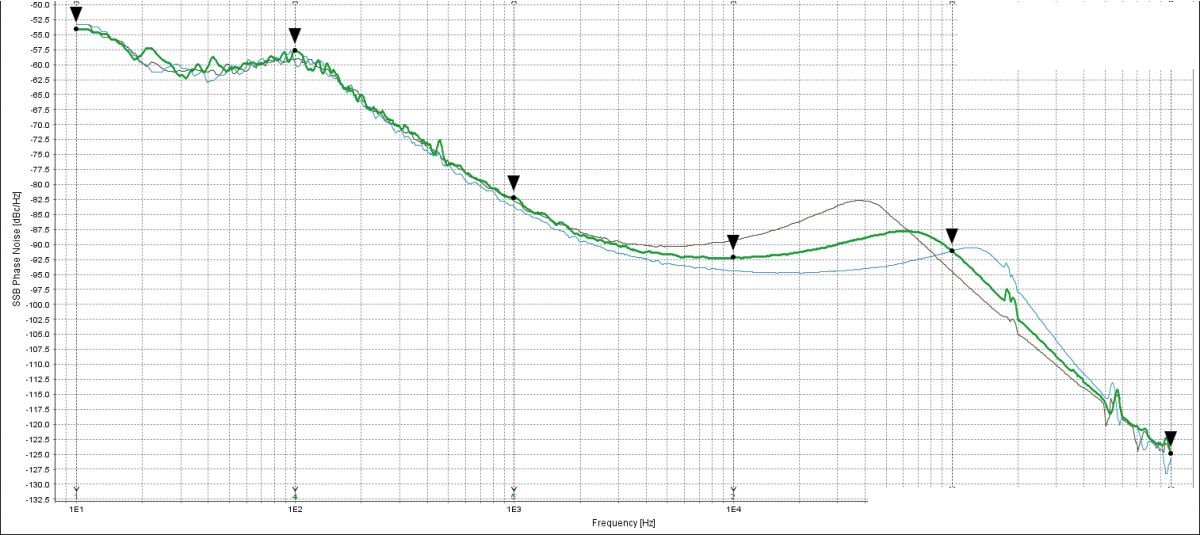
The curve has the shape of a locked source. Inside about 1 kHz it falls at a few decibels per decade, which is the reference and the loop; from 1 kHz to 10 kHz it falls at 10 dB per decade; between 10 kHz and 100 kHz it flattens and, on two of the three settings, rises into a peak near the loop bandwidth, which is where the loop's gain margin shows; beyond 100 kHz it falls steeply toward the free-running VCO's slope and the analyzer floor. The three settings differ by several decibels in the peak region and agree elsewhere, which is what a charge-pump current change should do: it alters the loop gain and therefore the bandwidth and damping, and it does not touch the reference or the VCO's far-out noise.
Was the floor low enough? The analyzer's published sensitivity, after one correlation and with the standard references, is tabulated at 3 GHz and 10 GHz; a 6 GHz carrier lies between the two rows, and the worse row, 10 GHz, is the safe one to check against: −65 dBc/Hz at 10 Hz, −95 at 100 Hz, −120 at 1 kHz, −135 at 10 kHz, −140 at 100 kHz and −145 at 1 MHz. Against the marker values the margins are 11, 37.5, 38, 43, 49 and 20 dB. The smallest, 11 dB at 10 Hz, adds 0.33 dB to the reading; every other offset adds under 0.05 dB. One correlation was therefore sufficient for this device at every offset, and the comparison between settings, which is a difference between traces taken on the same floor, is better than that. For a synthesizer 20 dB better at 10 Hz, the margin there would vanish and the measurement would need Option LN, which lowers the 10 GHz 10 Hz floor to −80 dBc/Hz, or 100 correlations, which lowers every point by 10 dB at a cost of 100 × 0.8 s = 80 s.
3. What the trace integrates to
A link or clock budget uses the integrated rms phase rather than the curve. Integrating single-sideband phase noise over a band gives it:
where L(f) is the single-sideband phase noise as a linear ratio (10−5.4 at 10 Hz for the trace above), fL and fH are the band limits (10 Hz and 1 MHz here), φrms is in radians, f0 is the carrier (6 GHz) and tj is the rms time jitter.
Taking the six marker values, read from the trace to the nearest 0.5 dB, and treating the curve as a straight line in dB against log offset between them, each decade integrates in closed form, and the five decades contribute:
- 10 Hz to 100 Hz, −54 to −57.5 dBc/Hz: 2.12 × 10⁻⁴ (48 percent of the total)
- 100 Hz to 1 kHz, −57.5 to −82: 1.18 × 10⁻⁴ (27 percent)
- 1 kHz to 10 kHz, −82 to −92: 1.45 × 10⁻⁵ (3 percent)
- 10 kHz to 100 kHz, −92 to −91: 6.65 × 10⁻⁵ (15 percent)
- 100 kHz to 1 MHz, −91 to −125: 3.30 × 10⁻⁵ (7 percent)
The sum is 4.45 × 10⁻⁴; doubled for both sidebands, φrms2 = 8.89 × 10⁻⁴ rad2, so φrms = 0.0298 rad = 1.71 degrees over 10 Hz to 1 MHz, and the jitter at 6 GHz is 0.0298 / (2π × 6 × 109) = 0.79 ps. Figure 3 draws the integration.
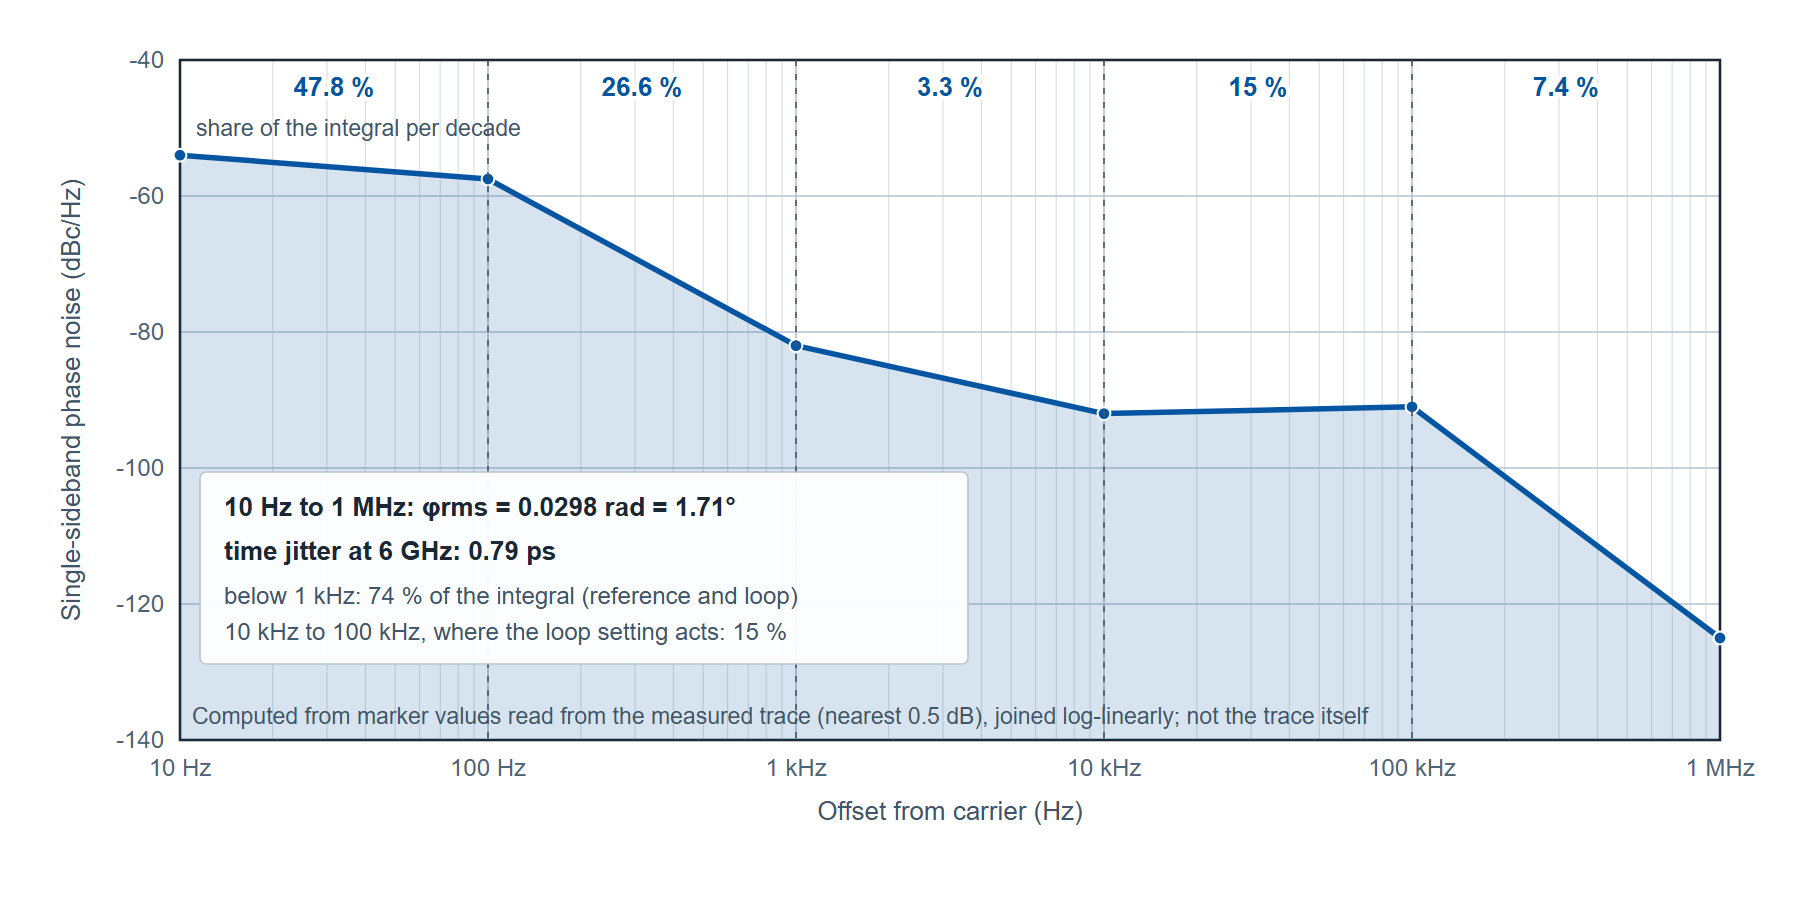
That share table is the design result. Three quarters of the integrated phase lies below 1 kHz, where the loop settings barely differ, so the charge-pump comparison, however clearly it shows on the plot, changes the integrated figure by a fraction of its 15 percent decade. Lowering the integrated phase of this synthesizer means a better reference or a different loop bandwidth, not a different charge-pump current. A plot comparison would have suggested the opposite; the integral settled it.
4. Drive level: the far-out floor is thermal
No number of correlations lowers the thermal floor. The analyzer's thermal noise is −177 dBm/Hz, so the far-out floor relative to the carrier is −177 dBc/Hz minus the carrier power in dBm: −162 dBc/Hz at the minimum input of −15 dBm, −177 at 0 dBm, −182 at +5 dBm and −187 at +10 dBm. The published sensitivity tables are stated at a carrier power of 5 dBm or more for this reason. The input accepts −15 to +20 dBm below 18 GHz and up to +23 dBm from 18 to 30 GHz, with a damage level of +26 dBm. The working rule is to drive the analyzer as hard as the device delivers cleanly, inside the published range and below the damage level, because every decibel of carrier power is a decibel of far-out floor. For the synthesizer above, with its 1 MHz marker at −125 dBc/Hz, the thermal floor at even −15 dBm input is 37 dB below the reading and not a limit; it becomes one for a source with a far-out floor near −160 dBc/Hz, which is where the difference between a 0 dBm and a +10 dBm drive is the difference between a 17 dB margin and a 27 dB one.
5. The supply regulator, measured before it reaches the carrier
A synthesizer's VCO converts supply noise into phase noise through its pushing coefficient, and a regulator's output noise spectrum therefore appears on the carrier, scaled by that coefficient and shaped by the loop. The usual way to find out whether a regulator is the limiting element is to change it and measure the carrier again, which costs a board revision per data point. The analyzer provides two shorter routes. Its baseband noise analysis measures a voltage directly on two rear-panel BNC inputs from 1 Hz to 100 MHz, with an input noise density below 3 nV/√Hz at 10 kHz after one correlation, a DC range of −12 to +12 V and 1 kΩ input impedance; a regulator's output can be measured in nV/√Hz and compared with the carrier's phase noise through the pushing coefficient without touching the board. And its two programmable DC supplies (0 to 15 V, 550 mA per channel, noise below 10 nV/√Hz above 20 kHz, output resistance below 0.5 Ω) and three tuning outputs (−5 to +20 V, noise below 2 nV/√Hz above 2 kHz) power and tune the device from the instrument, so that the bench supply is removed from the measurement and a regulator on the board can be compared against a known quiet source by substitution. In the measurement above, the three loop settings were compared with the device powered from the analyzer's supply, so the supply was the same for all three and the differences on the plot belong to the loop.
6. Procedure
- Warm up the analyzer and the device under test to the specification condition, 23 ±5 °C after 30 minutes; a synthesizer's reference oscillator may need longer to settle its frequency.
- Connect the device at the highest clean output level inside the published input range, −15 to +20 dBm below 18 GHz, and check the damage level of +26 dBm before connecting any amplified output.
- Power and tune the device from the analyzer's DC supply and tuning outputs where the device allows it, so the supply is not a variable.
- Set the offset range from the application: 10 Hz to 1 MHz here. The time per correlation is set by the lowest offset: 0.8 s from 10 Hz, 8 s from 1 Hz.
- Check the margin against the sensitivity table at the carrier, using the next higher tabulated carrier row, and choose the number of correlations so that the floor is at least 10 dB below the expected device noise at every offset of interest.
- Record one trace per setting on the same plot, with markers at each decade, and read the integrated rms phase over the band from the instrument or by the arithmetic of section 3.
- Report the band, the number of correlations, the carrier power and the reference with every result.
7. Limitations
The published accuracy is ±4 dB below 10 Hz offset, ±3 dB from 10 Hz to 1 kHz and ±2 dB above, so a close-in difference between two settings smaller than that is within the instrument's uncertainty, even though a difference between traces taken minutes apart on the same floor is usually repeatable to much better. The 6 GHz floor used above is interpolated from the published 3 GHz and 10 GHz rows by taking the worse, and a measurement that needs the exact floor at an intermediate carrier should measure it with a known-quiet source. Cross-correlation does not remove a spur that is coherent in both channels, such as a reference leakage line, and it does not remove the device's own noise. The integration in section 3 uses six marker values and straight segments between them; the instrument's own integration over the full 250 points per decade will differ slightly, and where the curve has a peak between markers, as between 10 kHz and 300 kHz here, the segment approximation underestimates that decade.
A spectrum analyzer is enough when the source is 20 dB or more above the analyzer's own floor at the offsets of interest, which for the synthesizer above would hold against most spectrum analyzers at 10 Hz to 1 kHz and fail beyond 100 kHz, where the trace falls to −125 dBc/Hz. For a free-running VCO measured at its loop-free noise, a spectrum analyzer with a noise marker is a correct instrument.
Summary
- A direct spectrum measurement reads high by 10 log10(1 + 10−m/10): 0.41 dB at a 10 dB margin, 3 dB at none. Cross-correlation lowers the instrument's uncorrelated noise by 5 log10 N dB (10 dB at 100 correlations) and leaves the device's.
- Valon 5009 synthesizer at 6 GHz, 10 Hz to 1 MHz: −54, −57.5, −82, −92, −91, −125 dBc/Hz at each decade; integrated 1.71 degrees rms, 0.79 ps at 6 GHz; 75 percent of the integral below 1 kHz.
- Floor margin against the 10 GHz standard row after one correlation: 11 dB at 10 Hz (adds 0.33 dB), 20 dB or more elsewhere.
- Thermal floor −177 dBm/Hz: far-out floor in dBc/Hz is −177 minus the carrier power in dBm. Input −15 to +20 dBm below 18 GHz; damage +26 dBm.
- Baseband inputs: 1 Hz to 100 MHz, below 3 nV/√Hz at 10 kHz. DC supplies: 0 to 15 V, 550 mA, below 10 nV/√Hz above 20 kHz. Tuning outputs: −5 to +20 V, below 2 nV/√Hz above 2 kHz.
Definitions
Charge-pump current. The current a phase-frequency detector's charge pump sources into the loop filter; with the filter it sets the loop gain, and therefore the loop bandwidth and damping.
Correlation. One averaged measurement of the cross-spectrum of the two channels; the uncorrelated noise falls by 5 log10 N dB after N.
Cross-correlation. Measuring a device in two independent channels and averaging their cross-spectrum, so that noise common to both (the device) is kept and noise in one only (each reference and channel) is reduced.
Integrated phase noise. The rms phase error over a stated band, from equation (1).
Loop bandwidth. The offset at which a phase-locked loop's control of the VCO gives way to the VCO's own noise; near it the curve often peaks.
Pushing. The change of a VCO's frequency with supply voltage, in Hz/V; the coefficient that converts supply noise into phase noise.
Single-sideband phase noise, L(f). Noise power in a 1 Hz band at offset f, relative to the carrier, in dBc/Hz; half the one-sided phase spectral density.
Thermal floor. The noise density of a matched termination, −177 dBm/Hz as published for the analyzer, which sets the far-out floor relative to the carrier power.
Symbols
| Symbol | Meaning | Unit |
|---|---|---|
| L(f) | Single-sideband phase noise at offset f | dBc/Hz, or a linear ratio per Hz in the integral |
| f | Offset from the carrier | Hz |
| f0 | Carrier frequency | Hz |
| fL, fH | Integration band limits | Hz |
| φrms | Integrated rms phase error | rad (or degrees) |
| tj | rms time jitter | s |
| m | Margin of the device noise above the instrument floor | dB |
| N | Number of correlations | none |
Acronyms
DC direct current. DUT device under test. LN low noise (Option LN, the ultra-low-noise internal references). PLL phase-locked loop. RF radio frequency. SSB single sideband. VCO voltage-controlled oscillator.
Further reading
- 7000 Series Signal Source Analyzer datasheet (web edition) and the datasheet PDF, v1.25: sensitivity tables, measurement times, baseband and supply specifications.
- Phase noise measurement basics: the definitions, the three architectures and the floor arithmetic used here.
- Measuring an ultra-low-noise 100 MHz OCXO with cross-correlation: the case where the floor margin is hardest to obtain.
- Optimal low noise floors using external references.
Discuss your phase noise measurement
Berkeley Nucleonics builds the 7000 Series phase noise analyzers and signal source analyzers and offers them for sale and rent. Our application engineers would be glad to talk through a measurement, including the floor margin at your carrier and the correlations a comparison needs: request a quote or demo, write to info@berkeleynucleonics.com, or call 800-234-7858.