
May 17, 2023 - Noise-Parameter-Measurement Method
Noise Parameters
A noise factor (or equivalently a noise figure) of a device is a common metric for representing the amount of signal-to-noise-ratio (SNR) degradation due to noise generated by the device [1]. While noise factors are commonly used, they are not invariant quantities of the associated devices and are affected by how the devices are embedded into larger systems. To model noise factor dependence on the embedding, noise parameters are used [2]. There are four noise parameters: minimum noise factor, Fmin, equivalent noise resistance, Rn, and optimal signal-source admittance for minimum noise, Yopt = Gopt + jBopt. The noise parameters are related to the noise factor of a device by
F = Fmin + Rn / Gs [(Gs - Gopt)2 + (Bs - Bopt)2]
where Ys = Gs + jBs is the signal-source admittance.
Measurement of noise parameters involves driving the device with a few signal sources having different Ys (or equivalently reflection coefficients Γs determining F for each Ys, and then solving for the four noise parameters using these results. There have been several methods developed of selecting signal-source admittances Ys for measuring the noise parameters of a device [3-11]. Clearly there is an infinite number of Ys that can be selected for this purpose and some of such Ys may not be optimum for extracting noise parameters and may result in very long measurement time. Thus a selection of well-placed Ys, rather than selecting a large number of Ys admittances for high redundancy, is desirable to reduce measurement time while maintaining adequate accuracy and measurement uncertainty [4, 6, 9, 12]. [4, 9] investigated a uniform coverage of Ys within the Smith chart but have not shown theoretically why their proposed patterns were optimum. [6] has described a non-uniform Ys pattern by augmenting the pattern from [4] with extra admittances. [6] also compared the performance of the proposed pattern against that used by a commercial system and demonstrated superior performance. [12] removed any restrictions on how Ys pattern covers the Smith chart and instead performed a rigorous theoretical analysis of the system of equations, which are solved to extract the noise parameters, that showed that four Smith-chart regions of Yss guarantee a diagonally dominant system of equations and thus guarantee a solution. These four regions are dependent on identified scaling coefficients and can be modified to suite various measurement requirements and device stability conditions. NoiseTech identified the exibility and performance of the work in [12] as key components to NoiseTech's line of impedance generators. The following sections reproduce results from [12] to demonstrate the operation of the method.
Experimental comparision of measurement methods
The goal of teh experimental work in [12] was to demonstrate that the proposed 4-point admittance selection method extracts the same noise parameters within 3σ uncertainty as other established admittance patterns. [12] also showed that its method can measure noise parameters where the other methods cannot. This is an important finding in [12] , that NoiseTech is exploring in the design of their wide-band miniature impedance generators.
Experimental method comparison
All S-parameters were measured with a Keysight PNA-X vector network analyzer and averaged 32 times. The noise power measurements in [12] were performed by the Keysight N8975A noise gure analyzer with a N4000A noise source over a bandwidth of 4 MHz, centered at 2.4 GHz, and averaged 32 times.
The same receiver noise parameter information was used for all DUT noise-parameter extraction methods. Since these intermediate measurements are done once, DUT noise parameter measurements would appear to have smaller 3σ uncertainty than the total system uncertainty if all intermediate measurements were performed each time the DUT noise parameters were extracted. MiniCircuits ZVA-183, Avago MGA-16516, and Avago ATF-35143 amplifiers were measured with the different noise-parameter measurement methods. Five different admittance methods were measured and compared:
Cross: the cross method [4], which uses five admittances,
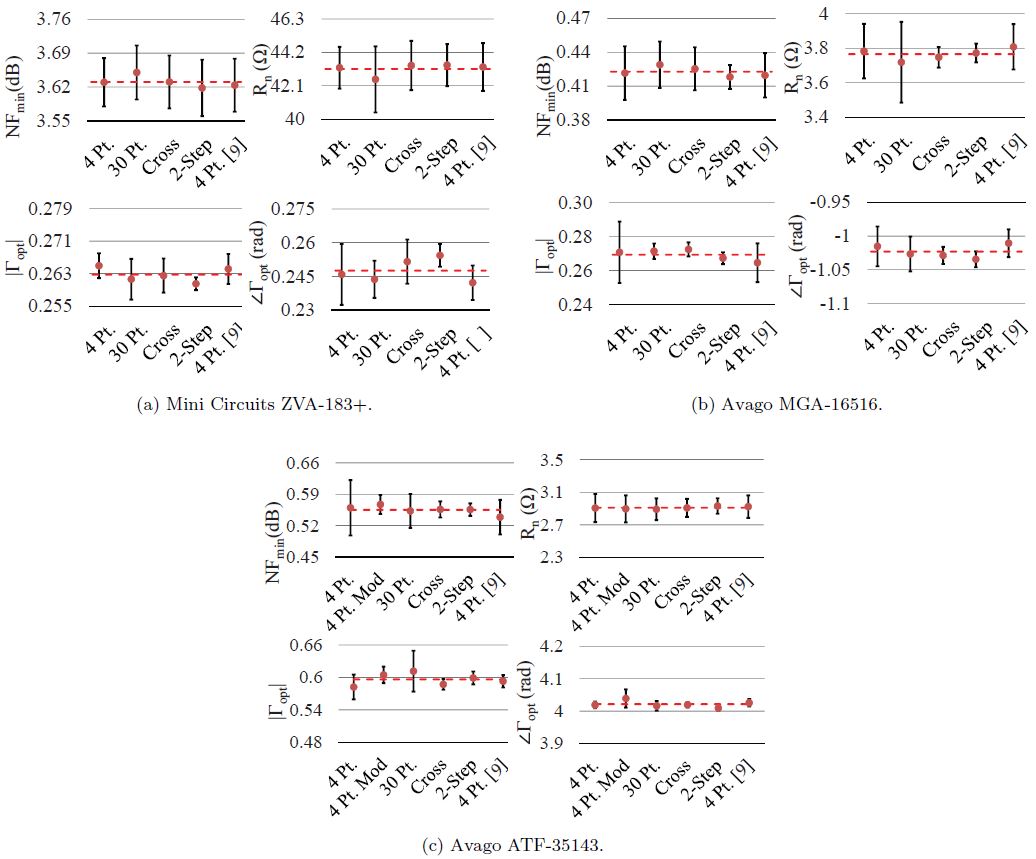
2-Step: the 2-step nine-point method [6], which uses the cross method as an intermediate estimate,
Random: a random 30 point method
4-pt [9]: the 4-point method from [9]
4-Pt: the proposed 4-point method.
Noise parameters for methods with more than four measurements were determined using a least-squares method, while direct solutions were possible with the two 4-point methods. 30 measured sets of noise parameters were averaged for each method to determine measurement statistics.
Fig. 1 shows the noise parameters for the three measured devices, which fall within 3σ measurement uncertainties of other methods. While the true value is not known, the estimated true value, the dashed red line in Fig. 1, was obtained by averaging results of all measurements across all methods. This reference line consisted of 150 noise parameter solutions for each device and used over 1560 noise figure/impedance measurement pairs per device. Between the three devices and all the noise parameters measured, the pattern that produced the lowest uncertainty was the 2-step method from [6] that uses nine admittances. However, all methods produced mean values within each others' 3σ uncertainties, demonstrating agreement.
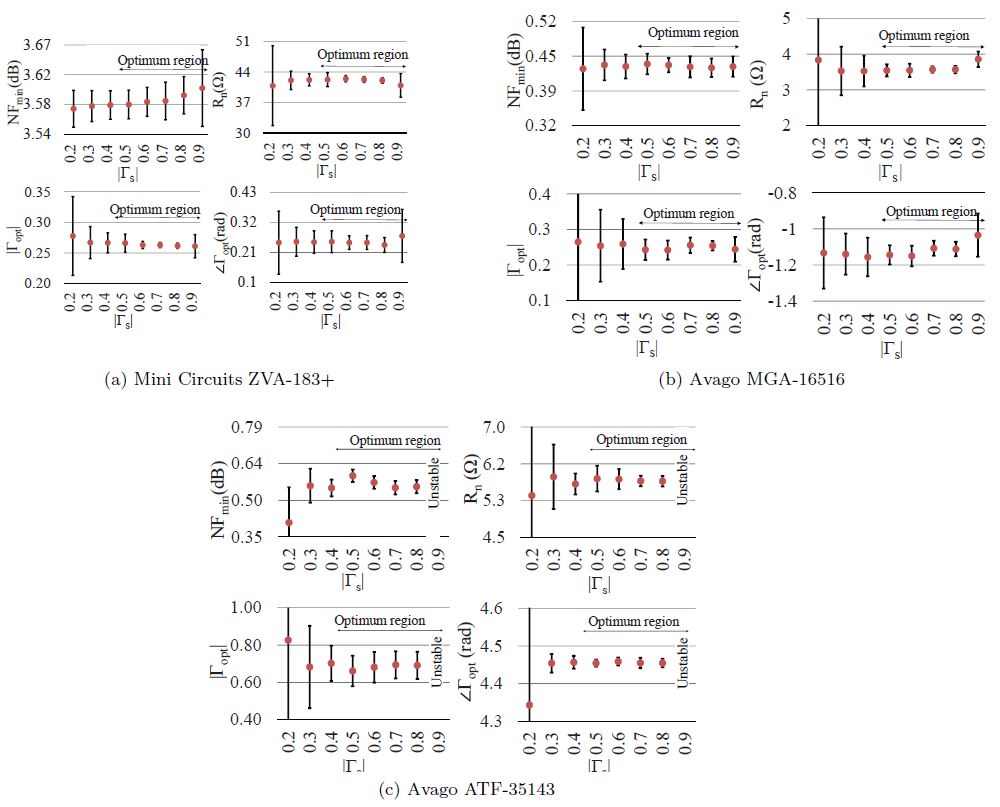
|Γs| was also swept to determine the regions that minimize measurement uncertainty. During the sweep and for each |Γs|, the noise parameters were measured 30 independent times to create the statistics shown in Fig. 2. These measurements showed that source admittances with |Γs| =< 0.2 => |Γs| => 0.9 can drastically increase noise parameter uncertainty. It can also be seen that there is a general minimum of uncertainty for most of the noise parameters between 0.5 =< |Γs| =< 0.8.
Wideband measurements
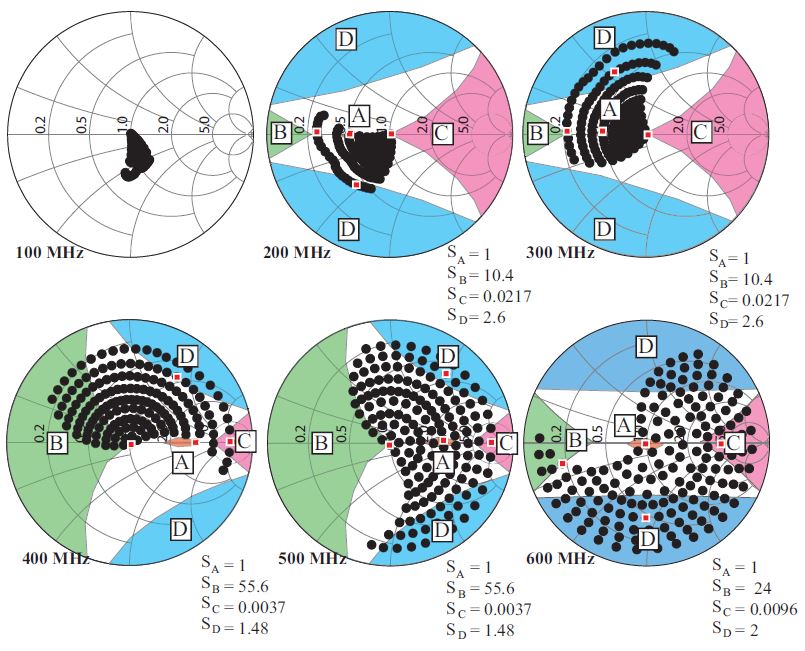
Additional measurements were performed on the Avago MGA-16516 to further demonstrate the flexibility of the proposed 4-point pattern in [12]. A mechanical slug-screw tuner used for measurements was incapable of producing a full set of admittances below 800 MHz due to its physical length being too short. The admittances generated by the tuner are shown with "•" and the admittances from [12] are labeled with red circles in Fig. 3. The method in [12] was able to adjust diagonal-dominant regions of Ys, thereby allowing the extraction of noise parameters significantly beyond what would be possible with the mechanical tuner. Since insufficient impedances are available for the 2-step method, the cross method, and the other 4-point method, these methods could not be used. Instead the measurements with the method from [12] were compared to results obtained with 30 random admittances. The statistics were generated for each method by repeating the measurements 30 times as with previous comparisons. At 100 MHz the [12] method is no longer able to intersect the signal-source admittances as they become too clustered near the center.
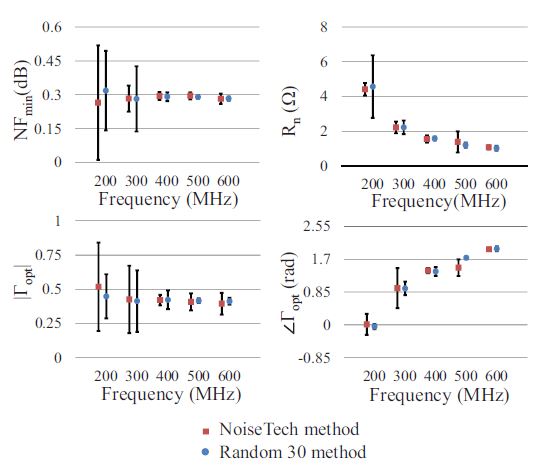
The measured noise parameters are shown in Fig. 4. [12] method produces mean noise parameter values very close to the least square solution generated by all available admittances. The noise parameters also changed nearly uniformly as a function of frequency, which indicates that uncertainty has not increased so high that the noise parameter solutions are unreasonable. The uncertainty increased in both the proposed pattern and the over determined pattern at frequencies at which the proposed pattern can no longer guarantee linear independence between source impedance measurements. At 100 MHz the uncertainty in noise parameters becomes too great and loses practical value.
Advantages of the NoiseTech's approach
Minimizing the number of source admittance measurements for accurate noise parameter determination is advantageous for reducing measurement time and simplifying the procedure. A 4-point method from [12] does not require a least-squares method of solving the linear system of equations because it is not over determined like other methods. The [12] pattern-selection procedure outlines four distinct admittance regions that can be used for general noise parameter measurements. It also allows for the change of scale factors that modify the size and position of regions A-D while accommodating diagonal dominance requirements. This method chooses Ys that are less sensitive to measurement uncertainty while still being guaranteed to produce a linearly independent set of noise equations.
The highlights of the pattern-selection procedure are:
- The knowledge of admittance regions resulting in linearly independent measurements has benefits for conditionally stable amplifiers for which some admittances have to be avoided.
- Wideband impedance tuners can be created such that their Ys remained within the regions described in [12].
- For reliable noise parameter extraction the |Γs| of the outer three admittances can be as low as ~0.4. This has benefits for measuring the noise parameters of devices at very high frequencies where the insertion loss of tuners increases.
- A drawback to other pattern-selection methods is that the tuner-generated reflection-coefficient patterns change with frequency. This drawback is avoided by NoiseTech impedance generators, which are designed to have their output reflection coefficients remain with the required regions over widebands of frequency.
Conclusion
The method in [12] describes a way of selecting linearly independent admittances with respect to noise parameters based on the diagonal dominance criterion. The diagonal dominance criterion predicted four regions of |Γs| that could be used to solve for the noise parameters. NoiseTech impedance generators are designed to produce sets of signal-source admittances Yss at the DUT input that remain within the required admittance regions over wide frequency range [13], thereby allowing NoiseTech to perform wideband noise parameter measurements quickly and with low uncertainty.