
March 3, 2023 - How Does Match Affect Power Measurements Using BNC RF Power Sensors?
When designing power sensors, efforts are made to achieve the lowest possible VSWR (SWR) to ensure that users have the best possible match when using them. However, perfect matching is never possible because no device, including power sensors, has a perfect SWR. As a result, even two power sensors of the same quality and calibration will give different readings when used in a user's system. In this brief, we will explore the reasons for this and discuss ways to achieve the most accurate power measurements.
Due to manufacturing limitations, variations in parts and components, differences in line lengths, and variations in detector properties, the VSWR of any power sensor is not perfect and can vary widely across frequencies. Even two high-quality power sensors will exhibit different VSWR characteristics at different frequencies. Figure 1, a chart from a BNC Power Sensor data sheet, displays the specifications and typical data for a production run of power sensors. The company also provides a table with limit (indicated by the red line in Figure 1) and typical data for several frequency ranges to assist users in making uncertainty calculations. Additionally, as frequency increases, VSWR also increases, underscoring the importance of understanding match when working with higher frequencies.
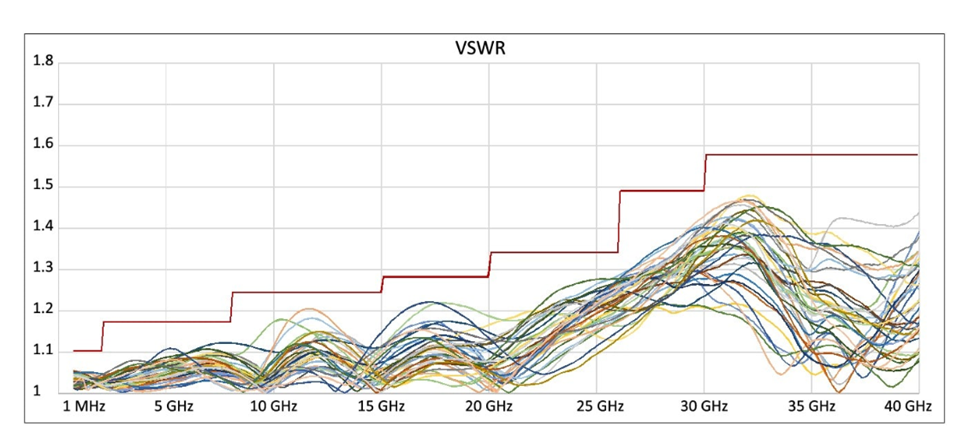
When comparing high-quality power sensors, you may notice that each one exhibits a better VSWR than the other at certain frequencies, even though they are similar overall. For instance, at 1 GHz, the BNC sensor has a limit specification of 1.13, while the Keysight™ U2000 is 1.15. However, at 15 GHz, both limit specifications are identical. Each sensor will have a frequency where it has a slightly better match. Although you can expect accurate measurements from either sensor, the actual VSWR of each sensor will not be the same. As a result, there will be a difference in sensor-to-DUT mismatch and slight variations in power readings. Moreover, when considering phase, the variations in power readings can exceed 0.1 to 0.2 dB, which can sometimes lead to confusion. In the following section, we will examine this in more detail.\
Let us consider a microwave source set to 1.00 dBm, connected to a power sensor. If the calibration and matching of the source and sensor were perfect, you would set and read 1.00 dBm. However, in reality, sources are calibrated with a 50-ohm load, but their actual output impedance is not 50 ohms. This is due to the source's broad driver requirements, driver technology limitations, and part variations. As a result, the VSWR is likely to be significantly different from 50 ohms, resulting in a high VSWR. Upon reviewing the published VSWR specifications for four different current model top-brand sources, we found that at 3 GHz, the VSWR values were 1.5, 1.6, 1.9, and 1.6.
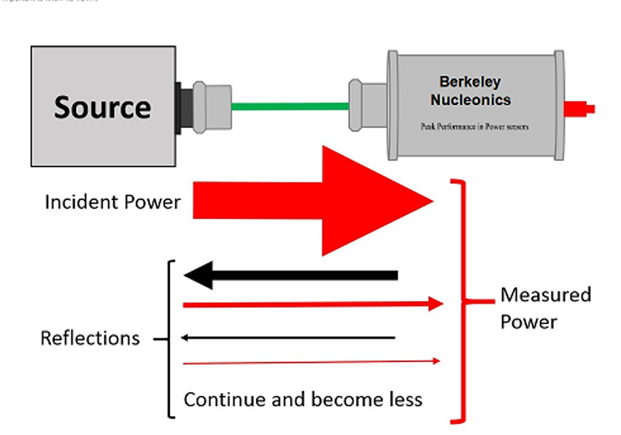
Although a power sensor's typical VSWR is much lower than that of a source, significant source reflection can result in an error that must be accounted for. This error is due to a small portion of the power being reflected back from the sensor to the source, with a fraction of it being re-reflected by the source and combined into the measurement (see Figure 2). Besides the amplitude, it is crucial to understand how the phase of the reflections can impact your measurement. If the reflected portion is in phase with the incident power, the measurement will increase, whereas if the reflected portion is 180 degrees out of phase, the measurement will decrease. At certain frequencies, the phase will be just right, resulting in a perfect measurement. The reflection will repeat, with each repetition becoming smaller. The total mismatch determines the magnitude of reflected power. In this situation, it is better to consider the reflection coefficient rather than the VSWR, even though they are functionally equivalent. The source could be any device generating power for measurement, and it is critical to know its VSWR.
To calculate the potential error, you need to know the reflection coefficient (ρ) of both the sensor and the DUT (device under test), which is the source in this case. The sensor’s ρ can be easily calculated from its specifications, and for this example, we will consider a VSWR of 1.10 as the worst-case scenario to keep things simple.
ρsens = (VSWR-1)/(VSWR+1)
ρsens = (1.10-1)/(1.10+1) = 0.048 = 4.8%
This worst-case number indicates that 4.8% of the power could be reflected back. During calibration, the match is mitigated in the applied power system so that the sensor can be calibrated correctly, and all power is measured, including that which was reflected back.
Now let’s do the same calculation for the DUT, which we assume to have a VSWR of 1.3, something that we might expect to see.
ρDUT = (VSWR-1)/(VSWR+1)
ρDUT = (1.3-1)/(1.3+1) = 0.1304 = 13.04%
If the above described source and sensor are directly connected there will be interaction due to the reflected power. Let’s calculate the mismatch interaction and total potential error due to mismatch using the formula:
Mm = (1+(ρsens * ρDUT))2-1
Mm = (1+(.048*.1304))2-1 = 0.0126 = 1.26%
The potential error in measurement due to mismatch is 1.26%. Since limit values (worst case specifications) were used, the error would be something less than this. If we had located and used typical numbers, we would have had a smaller number that was probably more accurate instead of this worst case result.
If we now consider a different power sensor which has a similar but not exact VSWR we will see slightly different results even if the calibrations are both perfect.
This second sensor has a VSWR of 1.11, just slightly different than the first.
ρsens = (VSWR-1)/(VSWR+1)
ρsens = (1.11-1)/(1.11+1) = 0.052 = 5.2%
The worst case number for the second sensors shows that 5.2% of the power could be reflected back from the sensor.
Since there is no change in the source, we can use ρDUT of 0.1304 and calculate the combined result as:
Mm = (1+(ρsens * ρDUT))2-1
Mm = (1+(0.052*0.1304))2-1 = 0.0136 = 1.36%
The potential error in this measurement due to mismatch is 1.36%, which is very close to the previous calculation of 1.26%. However, you cannot expect both sensors to measure exactly the same, even though both provide good measurements.
As demonstrated, even with the highest level of calibration, match can cause significant measurement uncertainty. Mismatch is generally considered the most significant factor contributing to total measurement uncertainty.
In cases where high source mismatch is present, the uncertainty can be reduced by adding an attenuator to the system. For instance, if a 3 dB attenuator is inserted between the source and sensor, the returned power from the sensor to the DUT is reduced, which minimizes the error resulting from the reflection back from the DUT. Although additional reflections are added on each side of the attenuator, these attenuator mismatch errors are generally small in comparison to the larger source mismatch in cases where large source mismatch is an issue. Users requiring the highest level of accuracy should take all factors into account.
While mismatch is usually the most significant component of a measurement's uncertainty, it is only one of many. Another important component is the sensor's Calibration Factor uncertainty. This uncertainty represents the accuracy of the sensor's calibration and is often stated by manufacturers as the sensor's accuracy because the DUT mismatch is unknown. However, sensor-to-DUT mismatch is most often a more significant uncertainty.
An easy way to begin calculating measurement uncertainty and increase your overall measurement accuracy and understanding is to use a power sensor manufacturer’s uncertainty worksheet or spreadsheet. For example, the last pages of the above-mentioned BNC power sensor’s datasheet include a worksheet and completed example that covers the most significant factors in a typical power sensor measurement. Most high-quality power sensor manufacturers provide similar worksheets.
While a power sensor manufacturer can supply specifications, it is not possible to determine the accuracy of any measurement without knowing the measurement parameters. Most of the specifications have an associated parameter such as frequency or power level. These parameters determine which specification from the sensor's datasheet is applicable. Once all parameters are known, they can be included in an RSS calculation to determine the total measurement uncertainty.
To sum up, in order to achieve the highest level of accuracy, it is important to differentiate between sensor accuracy and measurement accuracy. One can use the sensor's specifications to gain a comprehensive understanding of the measurement uncertainty, which in turn instills confidence in the measurement and enables further accuracy improvement as required.