
January 5, 2024 - SAM 940 plus: Response Curve for the Nal Detector
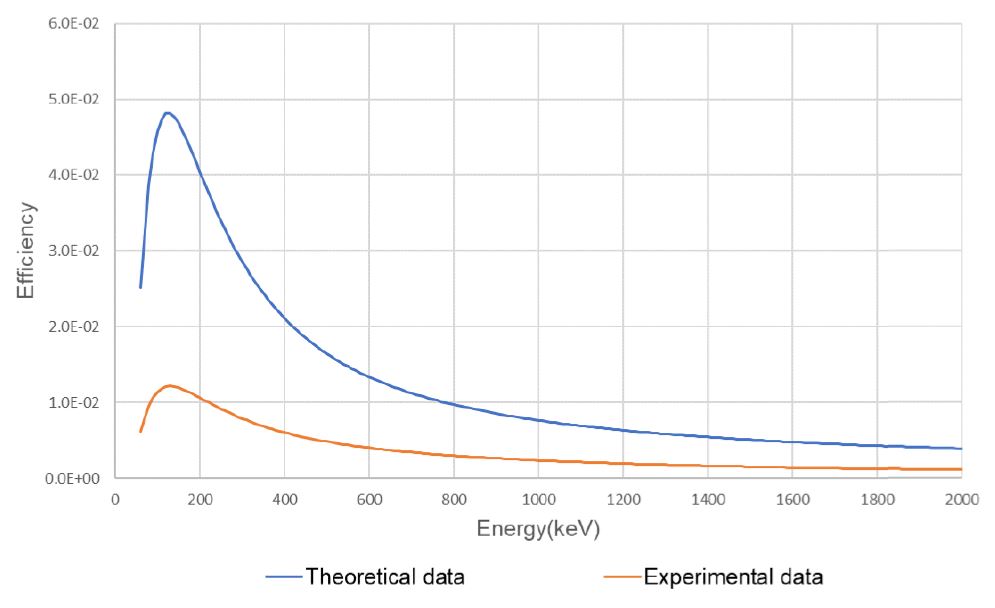
One aspect that measures the efficiency of isotope identifiers or RIIDS is their response curve. The response curve below refers to how the detector exhibits a sensitivity to a radioactive source at 5 cm. Berkeley Nucleonics offers a variety of isotope identifiers with different detector sizes (2x2, 3x3 etc) and materials (CeBr3, CLYC:Ce, etc). However, the response graph described here is for a standard 940plus with a 2” x 2” Nal detector. There are two curves - One is theoretical and the other is experimental. There is about a 25% - 30% discrepancy due to the quantum efficiency of the PMT. The Y-axis unit is the "probability." For instance, if one gamma photon is generated from the CRM source at a distance of 15 cm from the center of the detector surface, the y-axis value is the probability of the gamma photon.
Gamma interaction probability as a function of energy
Experimental probability of SAM 940+ is about 25% to 30% of theoretical data (QE of PMT: 25-30%)
Looking for more information about the SAM 940 plus? Please contact our technical experts and review our datasheet, found on the product page linked below.