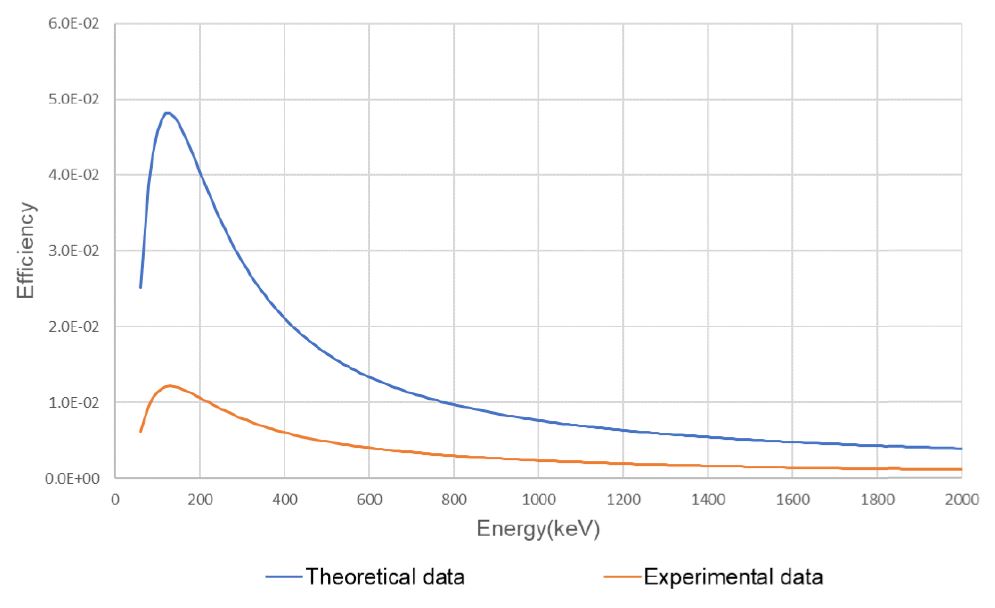
One aspect that measures the efficiency of isotope identifiers or RIIDS is their response curve. The response curve below refers to how the detector exhibits a sensitivity to a radioactive source at 5 cm. Berkeley Nucleonics offers a variety of isotope identifiers with different detector sizes (2×2, 3×3 etc) and materials (CeBr3, CLYC:Ce, etc). However, the response graph described here is for a standard 940plus with a 2” x 2” Nal detector. There are two curves – One is theoretical and the other is experimental. There is about a 25% – 30% discrepancy due to the quantum efficiency of the PMT. The Y-axis unit is the “probability.” For instance, if one gamma photon is generated from the CRM source at a distance of 15 cm from the center of the detector surface, the y-axis value is the probability of the gamma photon.
Gamma interaction probability as a function of energy
Experimental probability of SAM 940+ is about 25% to 30% of theoretical data (QE of PMT: 25-30%)
Looking for more information about the SAM 940 plus? Please contact our technical experts and review our datasheet, found on the product page linked below.